.avif)


How to Write an Environmental Monitoring Program? | Full Guide


Nearly 40% of food recalls in 2024 were caused by pathogens like Listeria and Salmonella, according to the Food for Thought 2025 report (U.S. PIRG) —a clear sign that contamination is still getting through.
An EMP is your early warning system. It gives your QA team structured, repeatable visibility into whether your facility environment could be harboring pathogens like Listeria monocytogenes or Salmonella before they reach your product. When it works, you find and eliminate contamination during routine operations. When it doesn't, someone else finds it for you.
This guide covers everything food safety practitioners need to build, run, and continuously improve an EMP: zone mapping, pathogen selection, testing tiers, corrective action workflows, GFSI certification requirements, and data management. Whether you're building your first program or tightening up an existing one, you'll find practical, audit-ready guidance throughout.
What Is an Environmental Monitoring Program?
EMP Definition
An environmental monitoring program (EMP) is a written, systematic plan for sampling and testing a food manufacturing facility's environment to detect microbial contaminants before they reach finished product. The environment includes equipment surfaces, floors, drains, walls, condensate points, and in some facilities, air.
A complete EMP has six core components: a written sampling plan, defined target organisms, a site map with zone assignments, a sampling frequency schedule, corrective action procedures, and a trend review process. Each component connects to the next. Your sampling frequency drives your data volume; your data volume makes trend review meaningful; your trend review informs corrective action decisions; and your corrective action records are what auditors and regulators examine.
Why EMPs Matter: The Business and Compliance Case
The CDC estimates that 48 million Americans experience a foodborne illness each year, resulting in 128,000 hospitalizations and 3,000 deaths. When a facility is linked to an outbreak, the business impact is severe: a Class I recall averages $10 million or more in direct costs, before accounting for liability, brand damage, and lost distribution agreements. (CDC Foodborne Illness Data and Statistics)
The 2024 data showing regulators detecting contamination before manufacturers is not a fluke. It reflects a structural gap in how many facilities run their environmental programs: sampling is done, records are kept, but the data isn't actioned in real time. A proactive EMP changes that by making contamination visible at the facility level before it becomes an outbreak or a regulatory finding.
The financial and reputational stakes are high enough that EMP investment pays for itself many times over. One prevented recall justifies years of program costs.
Who Is Required to Have an EMP?
Under FSMA's Preventive Controls for Human Food rule, facilities that produce ready-to-eat (RTE) products and identify an environmental pathogen as a hazard requiring a preventive control must implement environmental monitoring as a verification activity (21 CFR § 117.165). (FSMA Final Rule for Preventive Controls for Human Food)
In practice, EMP is a best practice for all food manufacturers, not just RTE producers. Dry processing facilities handling nuts, spices, or grain-based products face Salmonella risk regardless of whether their end product is technically RTE. Facilities pursuing SQF, BRCGS, or FSSC 22000 certification also face scheme-specific EMP requirements independent of FSMA. Your food safety plan should document how your EMP integrates with your broader preventive controls strategy.
The 4 Environmental Zones
The zone framework divides your facility into four areas based on proximity to food contact and contamination risk. Zoning drives everything from testing frequency to organism selection. Testing resources are finite, so zones help you concentrate effort where contamination risk is highest.
| Zone | Description | Example Sites | Primary Test | Frequency (Typical) | Target Organism |
|---|---|---|---|---|---|
| Zone 1 | Direct food contact surfaces | Conveyors, slicers, hoppers, utensils, packaging surfaces | Indicator + Pathogen | Weekly to Daily | Listeria spp., Salmonella |
| Zone 2 | Non-contact, adjacent to Zone 1 | Equipment frames, drip shields, control panels, pipes above Zone 1 | Indicator + Pathogen | Weekly to Bi-weekly | Listeria spp., Salmonella |
| Zone 3 | Non-contact, adjacent to Zone 2 | Floors, walls, drains, hoses, forklifts, mops | Indicator (primary), Pathogen (periodic) | Bi-weekly to Monthly | Listeria spp., Indicator organisms |
| Zone 4 | Remote from food processing | Break rooms, locker rooms, loading docks, maintenance shops | Indicator (periodic) | Monthly to Quarterly | Indicator organisms |
The Outside-In Zone Testing Strategy
You test Zones 3 and 4 primarily for indicator organisms, and reserve routine pathogen testing for Zones 1 and 2. The logic: if indicator levels are elevated in a Zone 3 drain, that's your early signal to intensify sampling in Zones 1 and 2 before a pathogen positive materializes on a food contact surface.
A Zone 3 indicator positive is not a crisis; it's a trigger to investigate. Your response is to increase sampling frequency in adjacent zones, identify potential transfer routes (foot traffic, shared cleaning equipment, air movement from drains), and investigate before escalating to pathogen testing in Zone 1. The FDA Environmental Sampling guidance outlines the verification activities expected during these investigations.
This outside-in approach lets you catch colonization early. Pathogens don't appear in Zone 1 without first existing somewhere in Zones 2 through 4. Monitoring the outer zones routinely gives you a lead time advantage.
How to Build Your Environmental Monitoring Program
Step 1: Assemble Your Cross-Functional EMP Team
Your EMP needs input from QA, sanitation, operations, and a Preventive Controls Qualified Individual (PCQI). The PCQI carries legal responsibility under FSMA for reviewing environmental monitoring results and signing off on corrective action records. If your facility doesn't yet have a designated PCQI, PCQI training is the starting point.
Sanitation supervisors and line operators know where water pools, where equipment is difficult to clean, and where recent modifications have been made. That operational knowledge is essential for building a sampling plan that reflects real harborage risk, not just the sites that are easiest to reach.
Step 2: Conduct a Facility Hazard and Risk Assessment
Before placing a single swab, understand your facility's risk profile. Product type matters significantly: a high-moisture, refrigerated RTE facility has a different contamination landscape than a dry spice processing plant. Look at floor drainage patterns, construction age, equipment condition, and your history of environmental results.
Walk the production floor with your team and identify harborage risks. Floor-wall junctions, drains with standing water, overhead pipes that condensate, hard-to-clean gaskets, and areas where water splashes during cleaning are all priority sites. Your HACCP principles framework provides the hazard analysis methodology to structure this assessment systematically. A GMP audit checklist is a useful companion here: hygiene and sanitation gaps it surfaces often correspond directly to the highest-risk zones in your EMP site map.
Step 3: Define Your Target Organisms
Target organisms should be driven by your product risk profile, which is covered in detail in the next section. For most food manufacturers, the core targets are Listeria monocytogenes, Salmonella, Enterobacteriaceae, and E. coli. Our guide to the Big 6 foodborne pathogens covers the highest-priority organisms and their controls. RTE facilities with high moisture typically prioritize Listeria; dry processing facilities focus on Salmonella.
Define both indicator organisms and pathogens. Indicators are tested routinely across all zones. Pathogens are tested in high-risk zones and when indicator results trend upward at specific sites.
Step 4: Map Sampling Sites and Assign Zones
Create a facility floor map that identifies specific sampling sites by zone. The Codex Alimentarius General Principles of Food Hygiene (CXC 1-1969) provides the foundational environmental hygiene framework that modern zone mapping is built on.
Don't limit yourself to obvious sites. Drain covers, floor-wall junctions, conveyor end-plates, and cooling unit drip pans are high-harborage areas that paper-based zone maps often miss. GFSI certification schemes specify minimum site counts per zone, so confirm your totals meet those thresholds before finalizing your map.
Step 5: Establish Sampling Frequency
Frequency depends on your zone, product risk level, facility history, and certification scheme requirements. A reasonable starting point for a high-risk RTE facility is daily or weekly sampling in Zones 1 and 2, bi-weekly in Zone 3, and monthly in Zone 4.
After a positive result, frequency increases immediately. You shift from routine monitoring to expanded investigation sampling until the site has cleared across multiple consecutive tests. Build this escalation logic into your written SOP so your team knows exactly when to escalate without needing approval each time. Slow escalation after a positive is one of the most common EMP failures cited during regulatory inspections.
Step 6: Write Your Sampling and Testing Procedures (SOP)
Your written SOP should cover aseptic collection techniques, the difference between sponge, swab, and drag swab collection methods, sample handling requirements, chain of custody documentation, and laboratory turnaround expectations.
Consistency is the core objective. Variability in swabbing technique, site location, or sample handling introduces noise into your data that makes trend analysis unreliable. Use document control software to version-control your SOP and ensure all sample collectors are always working from the current procedure, not a printed copy from two revisions ago.
Step 7: Establish Alert Limits and Action Limits
Alert limits trigger investigation. Action limits trigger immediate corrective action. These are different thresholds that require different responses, and conflating them is a common gap in EMP design.
An alert limit example: three consecutive positive indicator results at the same Zone 3 site triggers a root cause investigation. An action limit example: any Zone 1 pathogen positive triggers immediate product hold, production suspension, and PCQI notification regardless of prior history. Set your limits based on historical baseline data, then tighten them as your program matures and data volume increases.
Step 8: Train Sample Collectors
Training consistency matters as much as the SOP itself. Collectors who sample different spots within the same designated site, or who vary their swabbing pressure and technique, produce data that's difficult to trend reliably. Build a training record that documents site-specific procedures for each collector and verify competency periodically.
Cross-reference EMP training records with your broader food safety management system documentation so everything is captured in one location when auditors review training records.
What Pathogens and Organisms Should You Test For?
Listeria monocytogenes
Listeria is the primary concern in RTE, deli, dairy, and produce facilities operating in high-moisture, refrigerated environments. L. monocytogenes is particularly persistent because it grows at refrigeration temperatures, colonizes drains and equipment crevices for years, and tolerates cleaning chemicals better than most foodborne pathogens.
Your monitoring strategy should test for Listeria spp. (the indicator genus) in Zones 2 through 4 before escalating to L. monocytogenes confirmatory testing in Zone 1. This outside-in approach lets you catch colonization before it migrates to food contact surfaces. The FDA Draft Guidance on Control of Listeria monocytogenes in RTE Foods is the definitive reference for building your Listeria testing strategy.
Salmonella
Salmonella is the primary concern in dry processing environments: nuts, spices, grain-based products, protein powders, and pet food. Unlike Listeria, Salmonella survives in low-moisture conditions and can persist for months in dry facility environments. Standard wet-cleaning protocols effective for Listeria control are often insufficient for Salmonella in dry facilities.
Your sampling sites in a dry facility should include areas where product dust accumulates, raw material receiving and staging areas, and any locations where temperature differentials create condensation. These are where Salmonella takes hold.
E. coli and Enterobacteriaceae
Enterobacteriaceae and E. coli serve as indicator organisms for fecal contamination and sanitation effectiveness. They're fast to test for, relatively inexpensive, and give you a read on whether your cleaning program is achieving the hygiene levels your product risk requires. Elevated Enterobacteriaceae counts don't confirm pathogen presence, but they confirm that your sanitation process has gaps that need to be addressed before pathogen risk escalates.
Indicator Organisms vs. Pathogens: When to Use Each
| Test Type | Purpose | Speed | Cost | Use Case |
|---|---|---|---|---|
| Indicator organisms | Sanitation effectiveness, contamination risk signal | 24–48 hours | Lower | Routine monitoring across all zones |
| Pathogen testing | Specific organism identification | 24–72 hours | Higher | High-risk zones; elevated indicator trends; post-positive investigation |
Think of indicator testing as a smoke detector and pathogen testing as a fire investigation. Your smoke detectors run continuously; you call in investigators when there's a confirmed signal.
Review your food safety testing methods to see how environmental testing fits into your broader testing program.
The Four-Tier Testing Model
Most facilities use ATP testing and microbial testing without framing them as a coherent decision hierarchy. Each tier in the model below answers a different question, and knowing which tier to deploy where is what makes your testing program efficient rather than reactive.
Tier 1: Visual Inspection
Visual inspection is your first line of defense. It identifies visible soils, product residue, equipment damage, and sanitation failures before any laboratory testing begins. Inspection is free, real-time, and should happen before every sampling event.
A clean visual result does not clear a surface. Pathogens can be present at levels high enough to be dangerous without any visible residue. But a positive visual inspection alone is sufficient to stop production and trigger re-cleaning without waiting for lab results.
Tier 2: ATP Bioluminescence Testing
ATP testing detects biological residue on surfaces in seconds by measuring adenosine triphosphate, a molecule present in all living cells. High ATP readings indicate organic matter remains on a surface after cleaning, which correlates with contamination risk even without identifying a specific organism.
Use ATP for post-cleaning verification before Zone 1 surfaces contact product, and as a real-time feedback mechanism to identify sanitation gaps before microbial testing runs. Effective monitoring assumes effective sanitation. See our guide to cleaning and sanitation in the food industry for the cleaning side of the program. ATP does not detect specific pathogens, but it confirms whether cleaning has achieved the baseline hygiene level your microbial testing will be evaluating.
Tier 3: Indicator Organism Testing
Indicator testing detects categories of organisms (Enterobacteriaceae, coliform, aerobic plate count) as proxies for contamination risk. Results come back in 24 to 48 hours, making this your routine monitoring backbone across all four zones.
When indicator results trend upward at a site over consecutive tests, that's your signal to investigate and intensify sampling before escalating to pathogen testing. Indicator testing is how you catch problems while you still have time to address them proactively.
Tier 4: Pathogen Testing
Pathogen testing identifies specific organisms: Listeria spp., L. monocytogenes, Salmonella, E. coli O157:H7. Results take 24 to 72 hours depending on method (PCR versus culture-based). Routine pathogen testing should be concentrated in Zones 1 and 2. In Zones 3 and 4, pathogen testing is triggered by elevated indicator results or as part of an expanded investigation following a positive in a higher-risk zone.
Which Tier to Deploy Where?
| Zone | Tier 1 (Visual) | Tier 2 (ATP) | Tier 3 (Indicator) | Tier 4 (Pathogen) |
|---|---|---|---|---|
| Zone 1 | Always | Post-clean | Routine | Routine + Triggered |
| Zone 2 | Always | Post-clean | Routine | Routine + Triggered |
| Zone 3 | Always | Periodic | Routine | Triggered |
| Zone 4 | Always | As needed | Periodic | Triggered |
Corrective Actions When an Environmental Sample Tests Positive
This is where most EMPs have their largest operational gap. The sampling and testing is documented; the corrective action workflow often is not. A positive result without a documented, verifiable corrective action response is a compliance failure regardless of whether you did the right things operationally.
Immediate Response Protocol
If a Zone 1 site tests positive for a pathogen, place all potentially affected product on hold immediately. Notify your PCQI and QA manager. Begin expanded sampling at the affected site and adjacent sites in Zones 1 and 2. If the Zone 1 positive is confirmed on retest, suspend production from the affected line pending investigation.
Do not wait for a second positive to act. A single Zone 1 pathogen positive is an action limit event. The first confirmed result sets the clock on your response timeline.
Root Cause Analysis (RCA) Process
Your RCA should identify both where the organism entered the facility and where it has established. Common harborage sites include floor cracks and drain covers, condensate on overhead pipes and equipment, worn or damaged equipment gaskets, porous flooring materials, and areas disturbed by recent maintenance or construction activity.
Review recent operational changes: new ingredient suppliers, maintenance work, personnel changes, modifications to cleaning procedures, or equipment additions. Use a structured approach like a fishbone (Ishikawa) diagram to map potential causes systematically rather than investigating based on intuition. Virginia Tech's Extension publication on Common Questions When Developing an EMP provides practical RCA guidance for EMP corrective action scenarios.
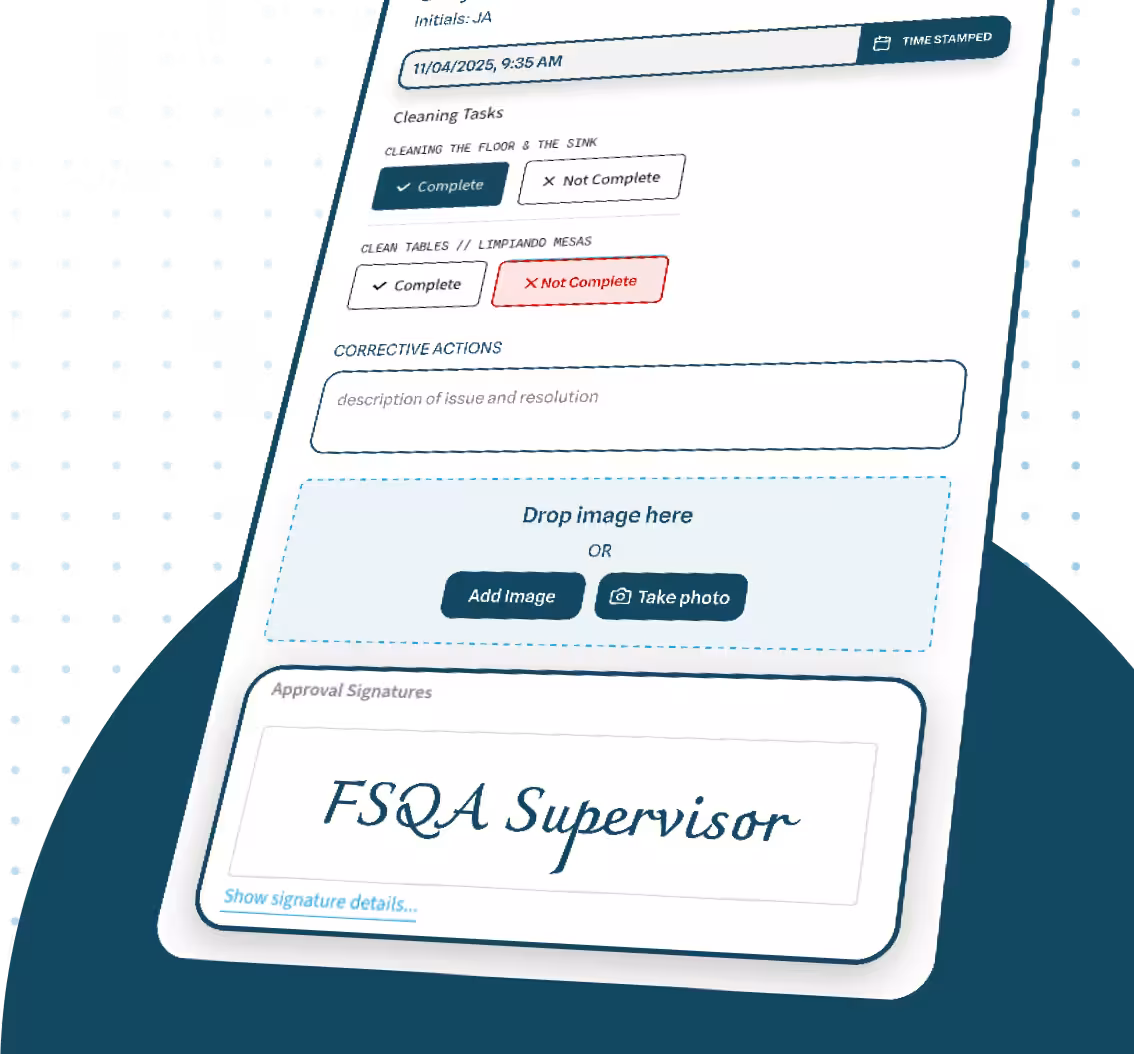
Corrective Action Documentation Requirements
Under FSMA, 21 CFR § 117.150 specifies the records you must maintain for corrective actions. Each corrective action record should include: the date and site of the positive result, the organism identified, the RCA findings, the specific actions taken (enhanced cleaning procedures, equipment repair, sanitation procedure modification), validation of effectiveness through retesting, and PCQI signature and date.
These records are what an auditor reviews when examining your EMP during a food safety audit. Missing or incomplete corrective action documentation is a more common audit finding than the positive result itself. (21 CFR Part 117)
Verification of Effectiveness
After corrective action, retest the affected site within one to two weeks. You're looking for consecutive negative results at the corrected site and adjacent areas. Do not close out the corrective action record until retesting confirms effectiveness across multiple samples.
If repeated positives continue at the same site after corrective action, you're dealing with an established harborage. Escalate to a full sanitation deep-dive, equipment assessment, or in high-severity cases, a recall risk assessment depending on the zone, organism, and product exposure window. Document every step through your food safety management system so your PCQI has a complete, auditable record.
EMP Requirements Across FSMA and GFSI Certification Schemes
If your facility holds or is pursuing SQF, BRCGS, or FSSC 22000 certification, your EMP must satisfy both FSMA and your certification scheme's specific requirements. The requirements overlap significantly, but each scheme has its own emphasis and prescriptive elements.
FSMA Preventive Controls Rule (21 CFR § 117.165)
Required for US facilities that produce RTE products with an identified environmental pathogen hazard. Core requirements: a written EMP, PCQI review of results and corrective actions, and records retained for at least two years. (FSMA Final Rule for Preventive Controls for Human Food) If your facility also falls under FSMA 204 traceability requirements, your environmental monitoring records and corrective action documentation should align with your broader traceability record-keeping structure.
SQF Code Edition 9
Module 11.7 covers environmental monitoring requirements. SQF requires a risk-based EMP, documented corrective actions, and management review of trending data at least annually. The SQF Practitioner holds sign-off responsibility for the program. (SQF Code Edition 9) See also: SQF certification and SQF audit checklist.
BRCGS Global Standard for Food Safety Issue 9
Section 4.11 covers housekeeping and hygiene requirements, which includes environmental monitoring. BRCGS is the most prescriptive of the three GFSI schemes: it requires defined test parameters, use of accredited laboratories, documented sampling frequency, and records demonstrating compliance across all zones. (BRCGS Global Standard for Food Safety) See also: BRCGS certification.
FSSC 22000 Version 6
FSSC 22000 V6 added a standalone clause for environmental monitoring: Clause 2.5.7. This clause requires a risk-based EMP and references the FSSC V6 Guidance Document for implementation specifics. (FSSC 22000 V6 Guidance Document on Environmental Monitoring) The Food Safety Team Leader holds sign-off responsibility. See also: FSSC 22000 Version 6.
Scheme Comparison
| Requirement | FSMA (21 CFR 117) | SQF Ed. 9 | BRCGS Issue 9 | FSSC 22000 V6 |
|---|---|---|---|---|
| Written EMP required? | Yes (RTE with env. hazard) | Yes | Yes | Yes |
| Risk-based approach? | Yes | Yes | Yes | Yes |
| Sign-off authority | PCQI | SQF Practitioner | Senior management | Food Safety Team Leader |
| Accredited lab required? | No | Recommended | Yes | Recommended |
| Trend analysis required? | Yes | Yes | Yes | Yes |
| Documented corrective actions? | Yes | Yes | Yes | Yes |
| Management review frequency | As needed / annually | Annually minimum | Annually minimum | Defined in program |
How to Trend and Analyze EMP Data
Collecting samples is the visible part of an EMP. Making sense of the data over time is what separates a program that finds contamination from one that prevents it.
Types of EMP Data to Track
Track three data streams: raw result logs (ATP RLU readings, CFU counts, positive/negative pathogen results), site-specific trend lines over time, and zone-level summary metrics. Raw logs give you operational visibility into what's happening now. Trend lines show you what's developing over weeks and months. Zone-level summaries give you program-level visibility for management review.
All three streams need to be current and accessible for your monthly and annual reviews to be meaningful.
Establishing Alert Limits vs. Action Limits
Set your alert and action limits before your program starts, not after you see your first results. Alert limits should be statistically informed by your baseline data once you have it. In the early stages of your program, conservative limits are safer: a limit that triggers too many false investigations wastes time, but a limit that misses real contamination events is a regulatory and food safety failure.
Best practice is to document your limit-setting rationale so that your PCQI and auditors can understand why your thresholds are where they are. As you accumulate historical data, review and tighten your limits during your annual program review.
Trend Analysis Techniques
Control charts (X-bar charts and run charts) are the standard tool for ATP data trending. A run chart showing increasing ATP values across consecutive post-clean readings at the same site is an early warning that your cleaning program is losing effectiveness at that location before you see a microbial result to confirm it.
Heat maps of facility zones that track hotspot accumulation across quarters help you identify systemic harborage issues that individual sample reports mask. Before-and-after comparisons of pre- and post-sanitation deep-clean data give you validation evidence for your corrective action records. This is the type of documentation your PCQI and auditors want to review.
PCQI and Management Review
Conduct a monthly operational review of EMP results with your QA and sanitation teams. Conduct a formal annual program review with management. Document both. Your annual review should cover trending summaries, corrective action closure rates, zone-level positive rates over the year, and any changes to testing frequency, organisms, or sites made during the year.
Managing this data volume in spreadsheets makes trend analysis time-consuming and prone to errors. Food quality management software centralizes result logs, corrective actions, and PCQI review workflows so your monthly and annual reviews pull from a single auditable source.
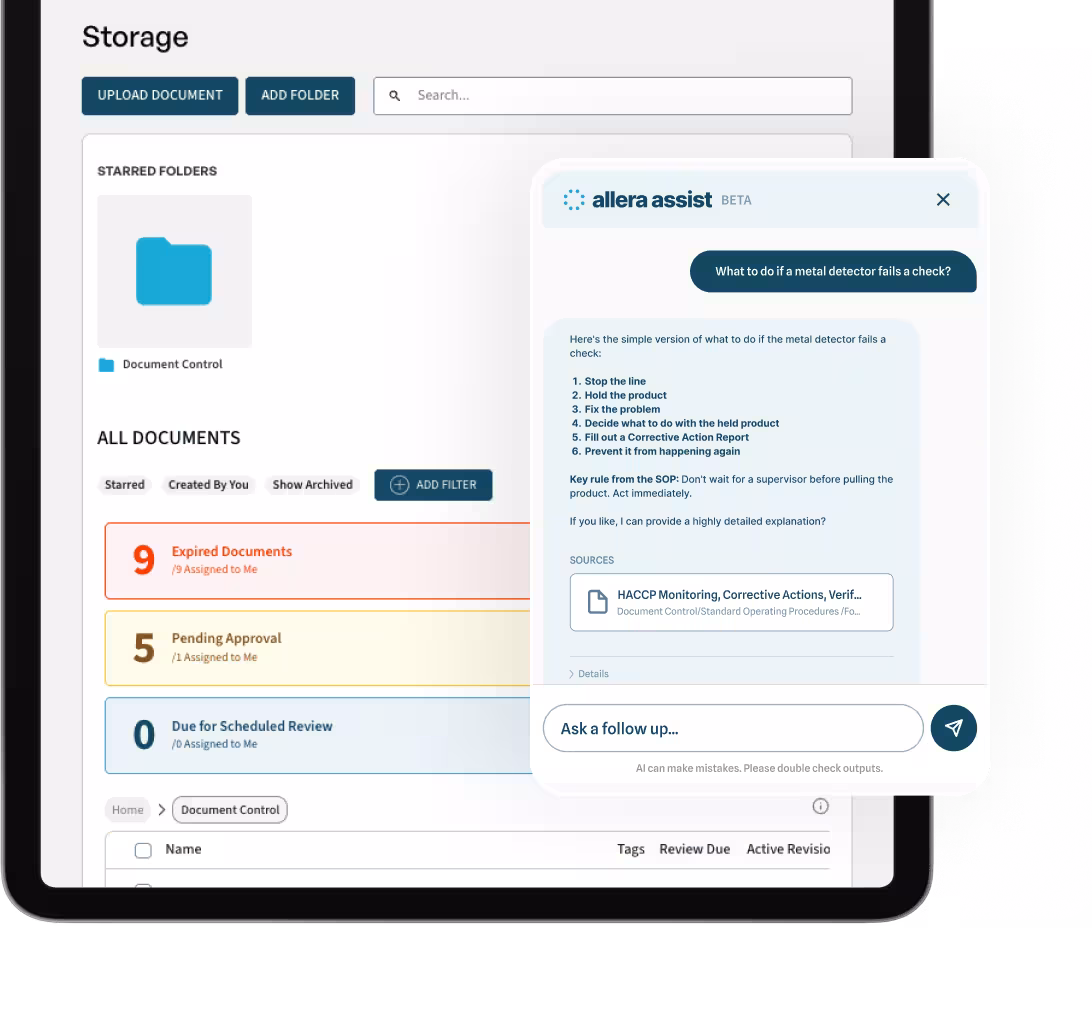
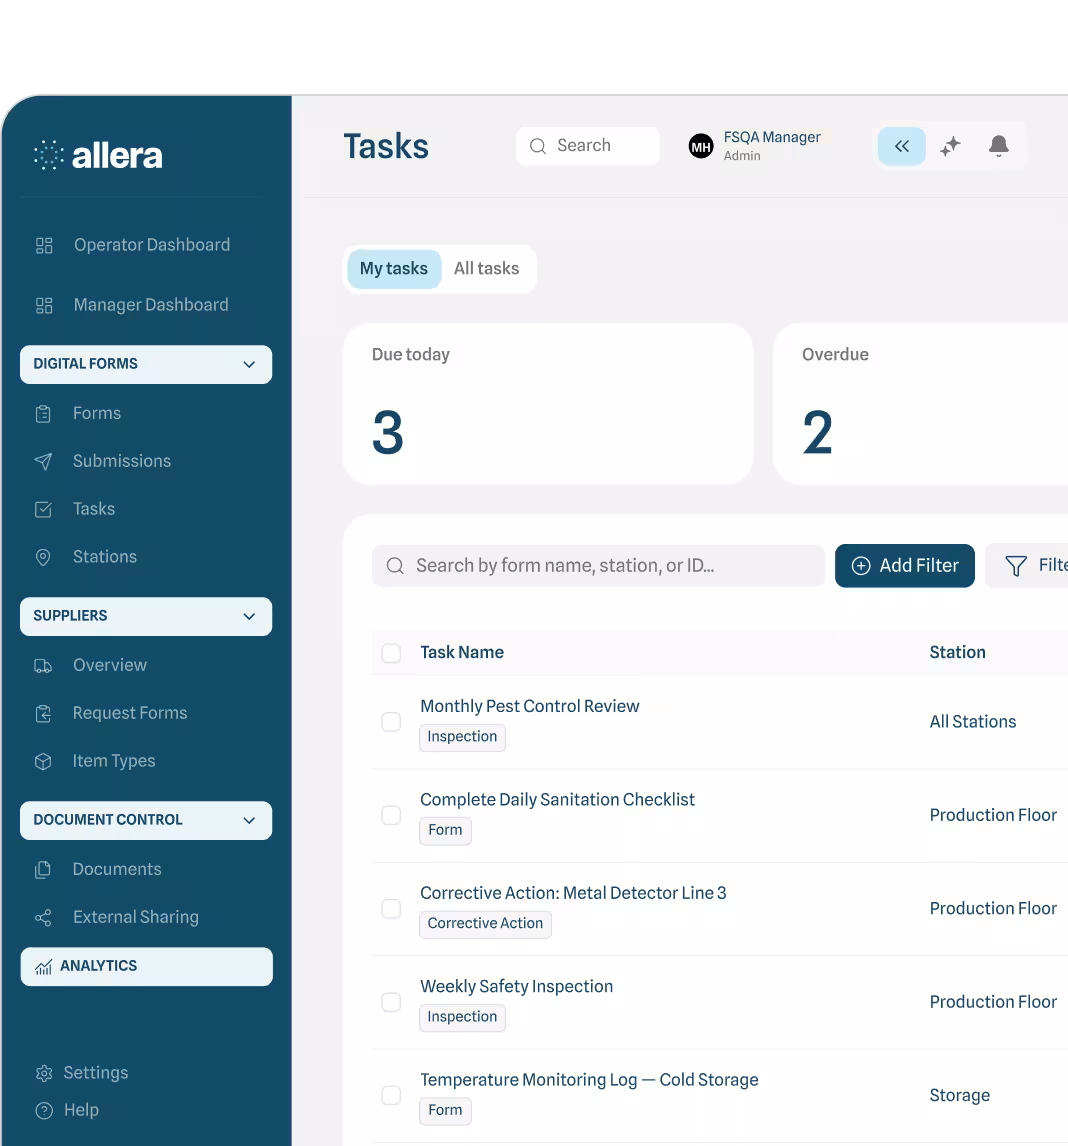
Managing EMP data in spreadsheets makes trend analysis difficult and audit prep slow. See how Allera centralizes food safety records, including EMP results, corrective actions, and PCQI sign-offs, in one platform. Learn how it works
Managing Your EMP With Software vs. Paper
Limitations of Paper-Based EMP Programs
Paper-based programs work at small scale with simple sampling plans and infrequent audits. They stop working when your program grows, when your audit frequency increases, or when a positive result requires you to pull months of corrective action records quickly to establish a timeline.
Manual transcription errors in result logs introduce data quality problems that make trend analysis unreliable. Corrective action records stored across multiple binders are difficult to retrieve during an audit and nearly impossible to trend against each other across time. There are no automatic alerts when action limits are breached, which means escalation depends on someone manually reviewing results and recognizing the trigger.
What to Look For in EMP Management Software
Digital EMP management should give you sampling site logs tied to your zone map, automatic alerts when results breach action or alert limits, an integrated corrective action module with PCQI review and sign-off workflow, and trend dashboards that roll up into management review reports.
Audit-ready record exports aligned with your certification scheme requirements (FSMA, SQF, BRCGS, FSSC 22000) mean your QA team isn't manually compiling records the week before an audit. When evaluating platforms, look for one that integrates EMP management with your broader food safety program, including your Good Manufacturing Practices (GMPs), HACCP plan, and supplier records, rather than running as a standalone tool.
Start Building a Stronger EMP Today
A compliant, effective environmental monitoring program has the same core components whether your facility produces deli meats, dry spices, or packaged produce: a written sampling plan, defined zones and target organisms, documented corrective action procedures, and a data management process that makes trend analysis actionable.
The hardest part is usually the last one. Most food manufacturers have a solid EMP on paper. The gap between a documented program and a working program shows up in corrective action documentation, trend analysis discipline, and PCQI review workflows, especially as the facility scales and the data volume grows.
Allera's food quality management platform helps QA teams track EMP results, automate corrective action workflows, and generate audit-ready reports without the spreadsheet overhead. If your program is due for a review, or you're building one from scratch, it's worth seeing what a purpose-built platform changes.
Schedule a 30-minute demo to see how Allera helps food manufacturers run structured, auditable EMPs. Book your demo
FAQs
What does an EMP program need to follow and comply with?
An EMP program needs to comply with relevant food safety regulations and standards, including:
FDA FSMA (Food Safety Modernization Act)
GFSI-benchmarked standards (such as SQF, BRCGS, FSSC 22000)
Company-specific food safety plans and HACCP systems
It must also follow documented procedures for sampling, testing, corrective actions, verification, and recordkeeping to demonstrate control during audits and inspections.
What are the 7 management plans that make up the environment of care?
The seven management plans that make up the Environment of Care are:
Safety management
Security management
Hazardous materials and waste management
Emergency management
Fire safety management
Medical equipment management
Utilities management
What are the five areas of environmental monitoring?
The five main areas of environmental monitoring in a food facility are:
Air – airborne contamination risks
Water – process and cleaning water quality
Surfaces – equipment, utensils, and facility structures
Personnel – hygiene practices like hand and clothing contamination
Waste systems – drains, trash areas, and other contamination sources
What is an example of environmental monitoring?
An example of environmental monitoring is swabbing a food processing line after cleaning to test for Listeria.
If the test detects contamination, the company investigates the source, re-cleans the area, and adjusts sanitation procedures to prevent recurrence.
What is a key component of an environmental monitoring program?
A key component of an environmental monitoring program is a risk-based sampling plan.
This determines where, when, and how often samples are collected based on contamination risk.
It typically divides the facility into zones (e.g., food contact vs. non-contact areas) and prioritizes high-risk areas to ensure early detection of hazards.
What is an EMP program?
An EMP program (Environmental Monitoring Program) is a formalized system within a food safety or quality management system designed to verify that sanitation and control measures are effective.
It includes defined sampling zones, testing schedules, lab analysis, corrective actions, and documentation to ensure the facility environment is under control and compliant with regulations like FSMA or GFSI standards.
What is an environmental monitoring program?
An environmental monitoring program (EMP) is a structured system used to routinely test and evaluate the conditions of a facility’s environment to identify potential contamination risks.
In food manufacturing, it focuses on detecting pathogens (like Listeria or Salmonella) on surfaces, equipment, air, and water to prevent contamination before it impacts products.
An effective EMP includes sampling plans, testing methods, corrective actions, and ongoing trend analysis.
What are the 4 types of environmental monitoring?
The four main types of environmental monitoring are:
Air monitoring – testing airborne particles, microbes, or contaminants
Water monitoring – checking water quality used in processing or cleaning
Surface monitoring – swabbing food contact and non-contact surfaces for contamination
Soil monitoring – analyzing soil for pollutants or biological hazards (more common in environmental science than food facilities)

.avif)
.avif)
.avif)

.avif)
%20(1).avif)
.avif)
.avif)

%20(1).png)


.avif)