.avif)



Water Activity (aw) in Food: Thresholds, Testing, and Control Limits

Water activity is the measure of how much water in a food is available to support microbial growth and chemical reactions. It runs on a scale from 0 to 1.0, and it predicts shelf stability and safety far better than moisture content does.
Two products can hold identical moisture and behave completely differently in storage. One stays stable for a year, the other grows mould in six weeks. Water activity explains the difference, which is why it appears as a critical limit in food safety plans across dried, cured, baked and confectionery production.
This guide covers what aw measures, the thresholds that matter for specific organisms, the 0.85 rule and what it triggers, how measurement works, and how to turn a published threshold into a limit you can defend at audit.
What Is Water Activity?
Water activity describes the energy state of water in a product, or more usefully, how freely that water can participate in biological and chemical processes.
Some water in a food is bound. It is held by proteins, sugars, salts and starches and cannot be used by bacteria or take part in reactions. The rest is free, and that portion is what determines whether the product supports microbial growth. Water activity measures the free portion.
Technically, the FDA defines aw as the ratio between the vapor pressure of the food itself and the vapor pressure of distilled water under identical conditions. Pure water has an aw of 1.0. A bone-dry material approaches 0.
Most foods land between 0.2 for very dry powders and 0.99 for fresh products.
Water Activity and Equilibrium Relative Humidity
Water activity equals equilibrium relative humidity divided by 100. If a product is sealed in a container until the air inside stops changing, the relative humidity of that air tells you the water activity of the product.
A product at 0.65 aw sitting in a room at 40 percent relative humidity will slowly give up moisture to the air. The same product in a room at 80 percent will pull moisture in. This is why packaging and storage conditions matter as much as formulation, and why an aw result taken at receipt does not stay true indefinitely.
Water Activity vs Moisture Content
These two get conflated constantly, and treating them as interchangeable causes real problems in formulation and shelf life work.
| Moisture content | Water activity | |
|---|---|---|
| What it measures | Total water present, as a percentage of weight | The proportion of water that is free and available |
| How it is expressed | Percentage | A ratio from 0 to 1.0 |
| What it predicts | Yield, cost, texture, compliance with a compositional standard | Microbial growth, chemical stability, shelf life, safety |
| Regulatory use | Standards of identity, labeling | TCS classification, thermal processing exemptions |
| Typical method | Oven drying, Karl Fischer titration | Dew point or capacitance hygrometry |
Consider two products at 20 percent moisture. One is a fruit paste loaded with sugar that binds much of that water, giving an aw around 0.75. The other is a lightly salted meat product where far more of the water is free, giving an aw around 0.93.
The first is shelf stable. The second supports the growth of several pathogens including Staphylococcus aureus. The moisture figure told you nothing useful about either.
Water Activity Thresholds for Microbial Growth
Every organism has a minimum water activity below which it cannot multiply. These thresholds are the foundation of aw as a control.
| Organism or group | Approximate minimum aw | Notes |
|---|---|---|
| Clostridium botulinum, type E | 0.97 | The most demanding of the common pathogens |
| Clostridium botulinum, types A and B | 0.93 | Higher tolerance than type E |
| Salmonella species | 0.94 | Survives far below this; growth is what stops |
| Listeria monocytogenes | 0.92 | Notably tolerant, and grows at refrigeration temperatures |
| Escherichia coli | 0.95 | |
| Most spoilage bacteria | 0.90 | |
| Staphylococcus aureus, aerobic | 0.86 | The practical bacterial floor |
| Most yeasts | 0.88 | |
| Most moulds | 0.80 | Includes many mycotoxin producers |
| Osmophilic yeasts | 0.61 | Relevant in high-sugar products |
| Xerophilic moulds | 0.61 | Relevant in very dry products |
| No microbial proliferation | Below 0.60 | No known organism multiplies here |
These are general reference points drawn from regulatory and academic sources including the USDA Agricultural Research Service Pathogen Modeling Program. Actual thresholds shift with pH, temperature, preservatives and the solute used to lower aw.
Why Staphylococcus aureus Sets the Practical Floor
S. aureus grows aerobically down to about 0.86, lower than any other common bacterial pathogen. It also produces a heat-stable enterotoxin, which means a thermal process applied after the organism has grown will kill the bacteria and leave the toxin intact.
That combination makes 0.86 the number most dried and cured product specifications are built around. Setting a limit at 0.85 gives a small margin below it, which is not a coincidence. Our guides to the Big 6 foodborne pathogens and the FATTOM model cover how moisture sits alongside the other growth factors.
The 0.85 Rule and TCS Classification
If one number from this article ends up in your food safety plan, it is 0.85.
Products with water activity controlled at 0.85 or below are exempt from significant parts of the low-acid canned food and acidified food regulations at 21 CFR Parts 108, 113 and 114. The threshold sits just below the S. aureus growth minimum, giving a margin against the most tolerant common bacterial pathogen.
How aw and pH Together Determine TCS Status
Water activity does not act alone in determining whether a food requires time and temperature control for safety.
The FDA Food Code uses an interaction table combining pH and aw. A product with aw at or below 0.88 is generally not TCS regardless of pH. A product with pH at or below 4.6 is generally not TCS regardless of aw. Between those bounds, the combination decides, and some pairings require a product assessment.
This is why reformulation work often targets both levers at once. Dropping pH slightly can permit a higher aw while keeping the product out of TCS classification. Our guide to TCS foods covers the classification in full, and temperature danger zone covers what happens when a product does fall into that category.
Water Activity by Product Category
Typical ranges are useful for sanity-checking a result before you investigate it.
| Product category | Typical aw range |
|---|---|
| Fresh meat, fish, poultry | 0.99 to 0.98 |
| Fresh fruit and vegetables | 0.99 to 0.97 |
| Bread | 0.96 to 0.93 |
| Soft cheeses | 0.96 to 0.91 |
| Cured and fermented meats | 0.92 to 0.80 |
| Hard cheeses | 0.92 to 0.85 |
| Jams and preserves | 0.86 to 0.80 |
| Dried fruit | 0.80 to 0.60 |
| Honey | 0.75 to 0.55 |
| Chocolate and confectionery | 0.60 to 0.40 |
| Flour and dry mixes | 0.60 to 0.45 |
| Spices and dried herbs | 0.60 to 0.30 |
| Milk and egg powder | 0.30 to 0.20 |
A result well outside the expected range for your category is usually a measurement problem before it is a product problem. Check equilibration and calibration before you condemn a batch.
Hurdle Technology: Combining aw with pH and Other Barriers
Few products rely on water activity alone. Most stable foods combine several partial barriers, each insufficient by itself, which together prevent growth.
This is hurdle technology. Rather than driving aw down to 0.6 and producing something nobody wants to eat, you combine a moderate aw reduction with acidity, a preservative, a thermal step and refrigeration.
| aw | pH below 4.6 | pH 4.6 to 5.6 | pH above 5.6 |
|---|---|---|---|
| Above 0.95 | Stable against most bacteria; yeasts and moulds still a risk | Requires additional hurdles or refrigeration | Requires full time and temperature control |
| 0.91 to 0.95 | Generally stable | Most bacterial pathogens controlled; assess case by case | Additional hurdles needed |
| 0.86 to 0.90 | Stable | Generally stable | S. aureus remains a consideration |
| Below 0.85 | Stable | Stable | Bacterial growth prevented; moulds still possible above 0.60 |
Treat this as an orientation aid rather than a decision tool. Hurdle combinations need validating for your specific product, and the interaction between barriers is not always additive. Our guide to shelf life testing covers how to generate that evidence.
How Water Activity Is Measured
Measurement looks simple and goes wrong in predictable ways.
Dew Point, the Primary Method
Chilled-mirror dew point instruments cool a mirror until condensation forms, detect that optically, and calculate water activity from the dew point temperature. This is a primary method, meaning it measures a fundamental physical property rather than inferring aw from a correlation.
It is fast, typically under five minutes, and accurate to around plus or minus 0.003 aw. It is the reference method most specifications are written against.
Capacitance and Resistive Sensors
Secondary methods use a polymer sensor whose electrical properties change with humidity. They are cheaper and more portable, and they need regular calibration against known standards because the sensor drifts.
Accuracy is typically plus or minus 0.01 to 0.02 aw, which is adequate for routine monitoring but may not be tight enough where a specification sits close to a regulatory threshold.
Temperature Equilibration
This is where most bad readings come from. Water activity is temperature dependent, and the sample and the instrument chamber must be at the same temperature when the reading is taken.
A sample straight from a chiller or a warm oven will read wrong, sometimes by enough to change a release decision. Let samples equilibrate to instrument temperature before measuring, and record the measurement temperature alongside the result. The FDA guidance specifically highlights temperature control during measurement as critical.
Calibration with Saturated Salt Standards
Verify instrument performance using saturated salt solutions with known water activity values. Common standards include lithium chloride at 0.111, magnesium chloride at 0.328, sodium chloride at 0.753 and potassium sulphate at 0.973.
Choose standards that bracket your working range. Verifying at 0.973 when your product specification sits at 0.82 tells you little about accuracy where it matters. Keep records the same way you would for any other measuring device, as covered in our thermometer calibration log guide, and see essential food safety testing methods for how aw sits alongside other analyses.
Setting aw as a Documented Critical Limit
A published threshold is not a critical limit. Turning one into the other is where the work is.
Building In a Margin
Start from the organism of concern and its growth threshold, then work down. If S. aureus grows at 0.86 and your product is a dried ready-to-eat snack, a critical limit at 0.85 is defensible but leaves no room. Many manufacturers set an operating target at 0.80 with a critical limit at 0.85, so normal batch variation never touches the limit.
Validation means holding evidence that your limit controls the hazard for your product. Published thresholds are a starting point, not validation. Challenge studies, predictive modelling or documented scientific literature specific to your product type are what make a limit defensible.
Where and How Many Samples
Water activity is rarely uniform across a batch, particularly in dried products where drying is uneven across a tray, a belt or a room.
Sample from the worst case, meaning the least-dried location, not a convenient one. Establish where that is during validation by mapping across the dryer, and then sample there routinely. Record the number of samples, their locations and how they were composited.
Sampling before packaging and after equilibration gives different results. Decide which one your specification refers to and be consistent, because a product can continue to redistribute moisture internally for days after packing.
Monitoring Frequency and Records
Frequency should reflect process variability and how much product sits between checks. Batch-by-batch testing before release is common where aw is a critical control point. Periodic verification with in-process controls is used where the process is highly consistent and validated.
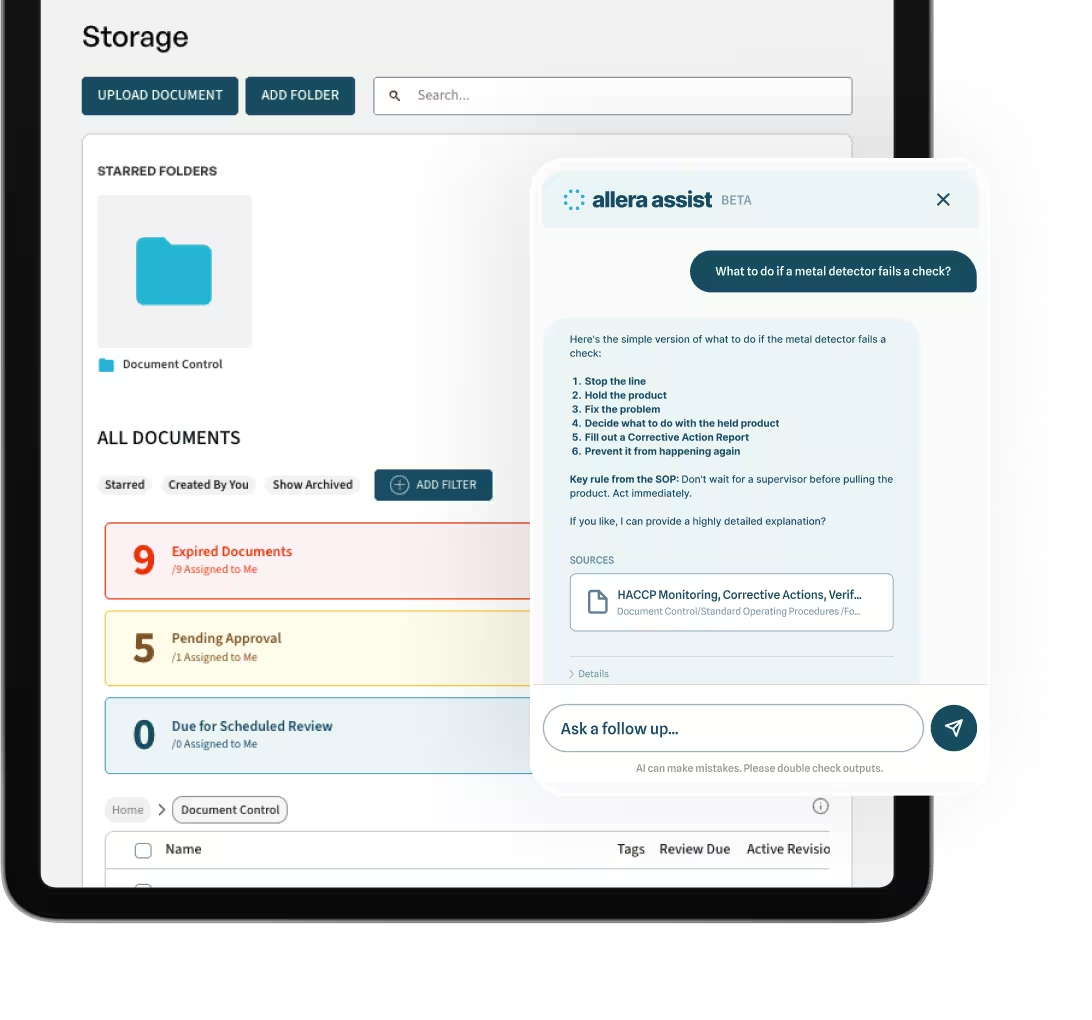
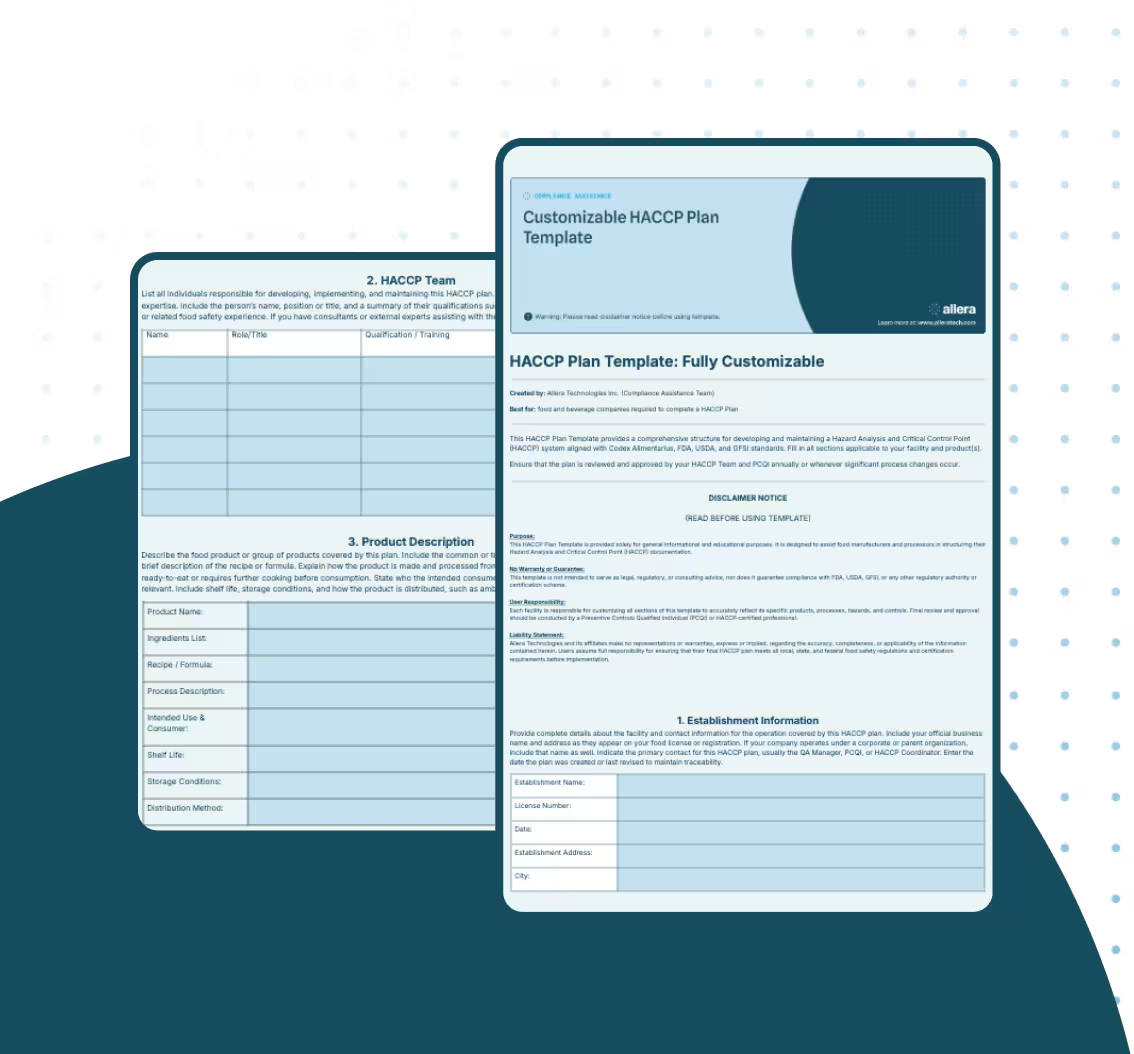
21 CFR Part 117 requires monitoring of preventive controls, corrective action when limits are not met, and verification that the system works. Records are the evidence, and their absence is treated as absence of control. See our guides to critical control points, HACCP principles, hazard analysis and food safety plan for how these fit together.
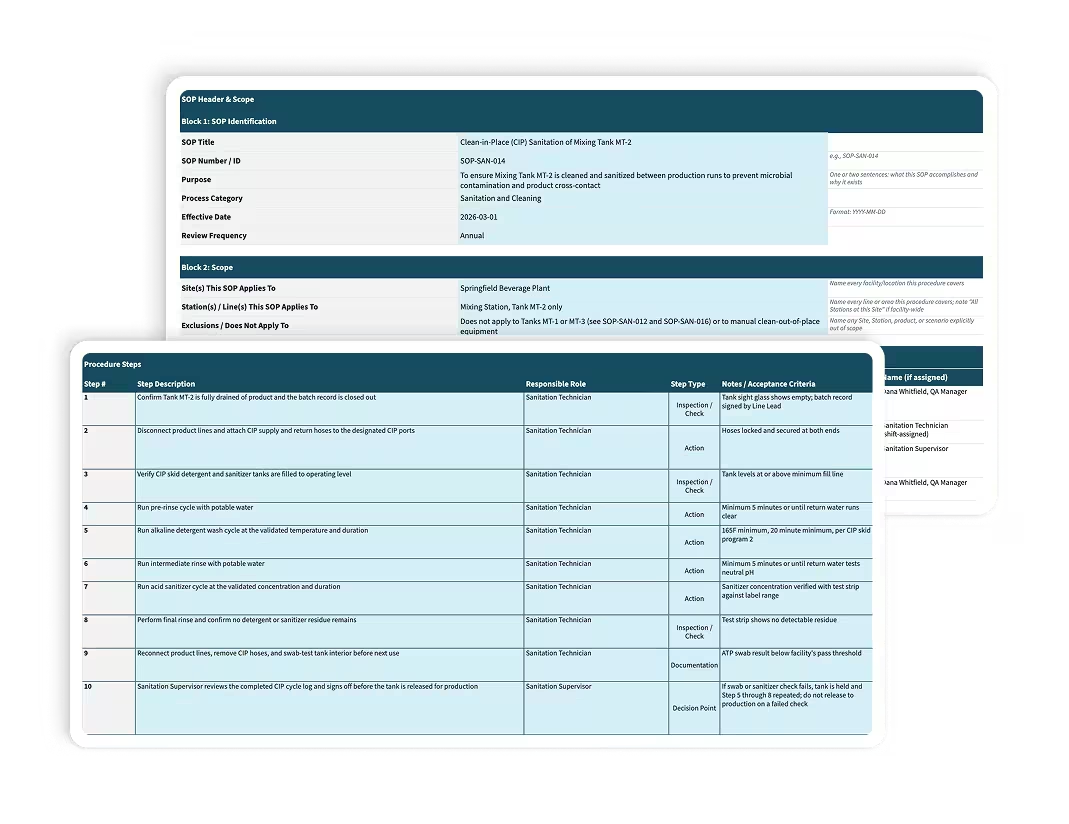
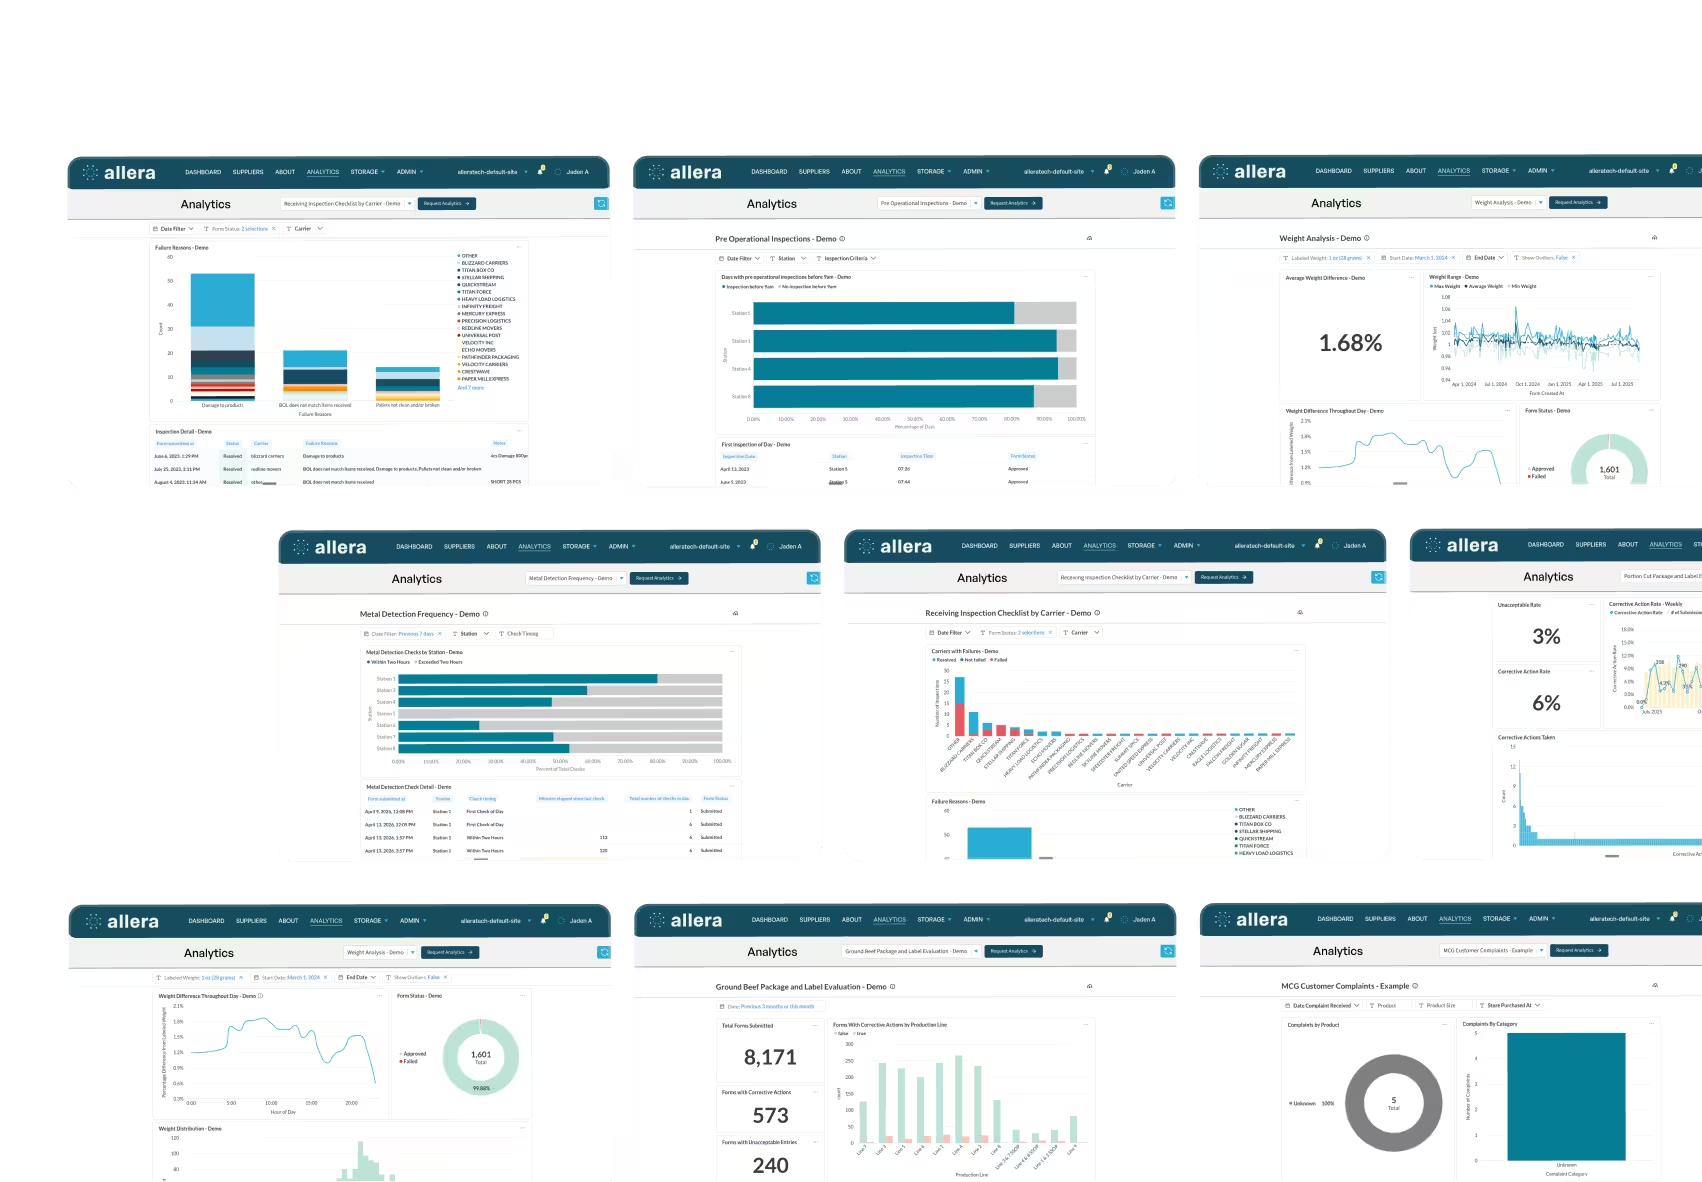
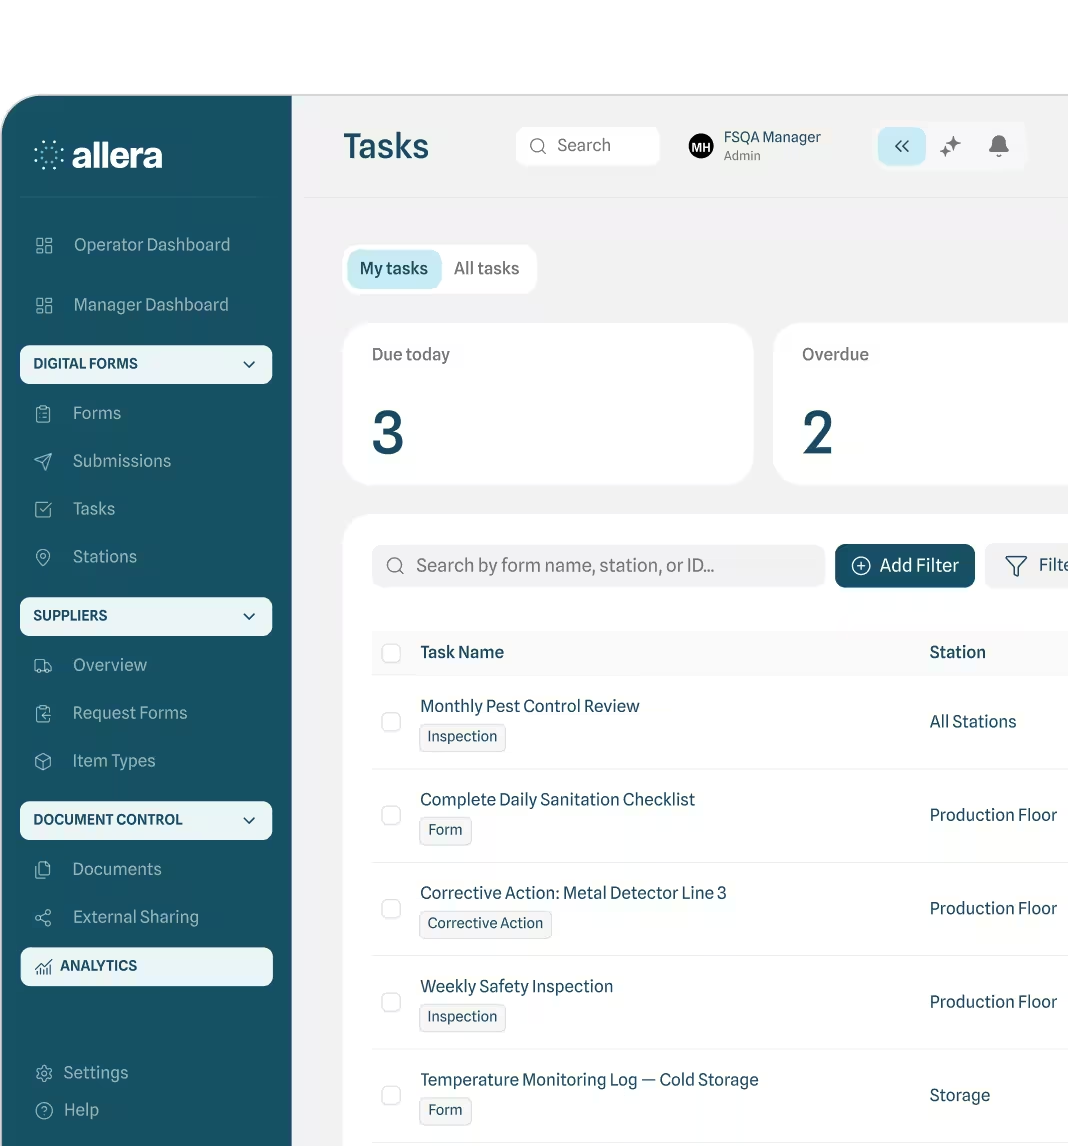
Results that arrive on a printout and get filed in a binder tend to be reviewed long after release decisions have been made. Allera replaces paper quality forms with digital forms that carry your specification limits at the point of entry, so a result outside the limit is flagged as it is recorded and a Corrective Action follow-up task is created automatically. See the food quality management software page for how that works across multiple Sites.
When a Result Comes Back Out of Specification
An aw result above your limit is a release decision, not a data point.
Hold the batch first. Then establish whether the result is real. Re-test using a fresh sample, confirm the instrument was in calibration, confirm temperature equilibration, and check whether the sample was taken from the usual location. Measurement error is a common cause, and confirming it is quick.
If the result is real, the batch is outside its validated safety parameters and needs assessing against the specific hazard. A product at 0.88 against a limit of 0.85 is in the range where S. aureus can grow, and the assessment has to consider storage time and temperature since production.
Disposition options usually include further drying where the process allows, diversion to a product with a higher permitted aw, or rejection. Record the deviation, the investigation, the disposition and the justification. Our guide to building a corrective action plan covers closure, and certificate of analysis covers how aw results should appear on documentation you send or receive.
What SQF, BRCGS and FSSC 22000 Expect
No scheme sets an aw limit for you. They require you to identify where aw is a control, set a validated limit, monitor it and evidence it.
SQF Edition 10 requires validated critical limits with monitoring records and corrective action procedures. BRCGS Issue 9 covers aw under process control and product testing, with an emphasis on method validation and calibration. FSSC 22000 Version 7 follows ISO 22000 in requiring control measures to be categorised, validated and verified.
Expect auditors to ask for calibration records, the validation basis for the limit, the sampling plan and its rationale, and a worked example of what happened the last time a result failed. Our comparison of GFSI, SQF and BRCGS covers the structural differences.
Bringing It Together
Water activity is the most reliable single predictor of whether a food will support microbial growth, which is why it appears as a critical limit across so much dried, cured and baked production.
Getting value from it requires three things. Knowing the threshold for the organism that actually concerns your product, setting a limit with enough margin that normal variation does not breach it, and measuring properly with equilibrated samples on a calibrated instrument.
If your aw results arrive on a printout and get filed without a check against the specification, see how Allera's food quality management software flags a failure at the moment it is recorded.
FAQs
What water activity level stops bacterial growth?
Below about 0.86 no common bacterial pathogen grows, with Staphylococcus aureus the most tolerant. Clostridium botulinum stops around 0.93 and Listeria monocytogenes around 0.92.
Moulds and osmophilic yeasts continue well below that, down to around 0.61, so a product safe from bacteria may still spoil.
Why is 0.85 the important number in water activity?
Products with water activity controlled at 0.85 or below are exempt from significant parts of the low-acid canned food and acidified food regulations at 21 CFR Parts 108, 113 and 114.
The figure sits just below the growth minimum for Staphylococcus aureus, which at approximately 0.86 is the most tolerant of the common bacterial pathogens. That margin is the reason 0.85 became the regulatory threshold.
What is the difference between water activity and moisture content?
Moisture content is the total water present as a percentage of weight. Water activity is how much of that water is free and available.
Two products at the same moisture content can have very different water activities depending on what binds the water, and therefore very different shelf lives. Water activity predicts safety and stability; moisture content does not.
How to calculate water activity in food?
Water activity is not calculated from a recipe, it is measured. It equals the equilibrium relative humidity of the air around the sample divided by 100.
Chilled-mirror dew point instruments are the primary method and typically return a result in under five minutes. Let the sample equilibrate to instrument temperature first, because water activity is temperature dependent and skipping equilibration is the most common cause of an inaccurate reading.
What lowers water activity in food?
Anything that removes free water or binds it. Drying, baking and evaporation remove it. Salt, sugar, glycerol and other humectants bind it.
You can also reduce water activity without changing the recipe by extending drying time, adjusting drying temperature or changing airflow. Packaging and storage humidity affect the water activity a product holds over time.
Why is water activity 0.6 important?
Below approximately 0.60 water activity, no known microorganism multiplies. It is the floor at which microbial growth stops entirely, including osmophilic yeasts and xerophilic moulds.
Organisms can still survive below 0.60 without growing, so a low water activity product is shelf stable rather than sterile. Dried spices and powders typically sit in this range.
What is the water activity in food?
Water activity is the proportion of water in a food that is free and available to support microbial growth and chemical reactions, measured on a scale from 0 to 1.0.
Water bound by sugars, salts, proteins and starches does not count toward it. Most foods sit between 0.2 for very dry powders and 0.99 for fresh products.

.avif)
.avif)
.avif)

.avif)
%20(1).avif)

.avif)
.avif)

%20(1).png)

.avif)



.avif)